
Ask workers when they'd like to retire, and most say before 60. Ask when they think they actually will, and the answer drifts into their sixties. Few are counting on a state pension or an employer to get them there—and one in ten expect to be working for the rest of their lives.
Kickresume surveyed 1,294 people worldwide to find out how workers are approaching retirement: when they want to stop working, what they think they’ll need, and what they’re doing to get there.
Here are some of the key findings:
- 54% want to retire before 60. Only 28% expect to, and 10% don't think they'll ever retire.
- 60% expect to fund retirement from personal savings and investments. Only 24% expect a state pension and 22% an employer one.
- 20% expect to keep working for income. Another 11% don't know where the money will come from at all.
- 67% think retiring comfortably will be harder for them than it was for their parents. In the US, 79% say so.
- Women are twice as likely as men to expect never to retire (14% vs 7%), while saving at the same rate.
- A third say they'd need more than $5,000 a month to retire comfortably. Yet 13% aren't doing anything at all to prepare.
- Asked what would help most to retire comfortably, 25% named higher income now.
People Want Out at 58—But Expect to Work Until 62
Everyone has an idea of when they’d like to stop working. The harder question is when they think they actually can. We asked everyone for both their ideal and expected retirement age, and here’s what they told us:
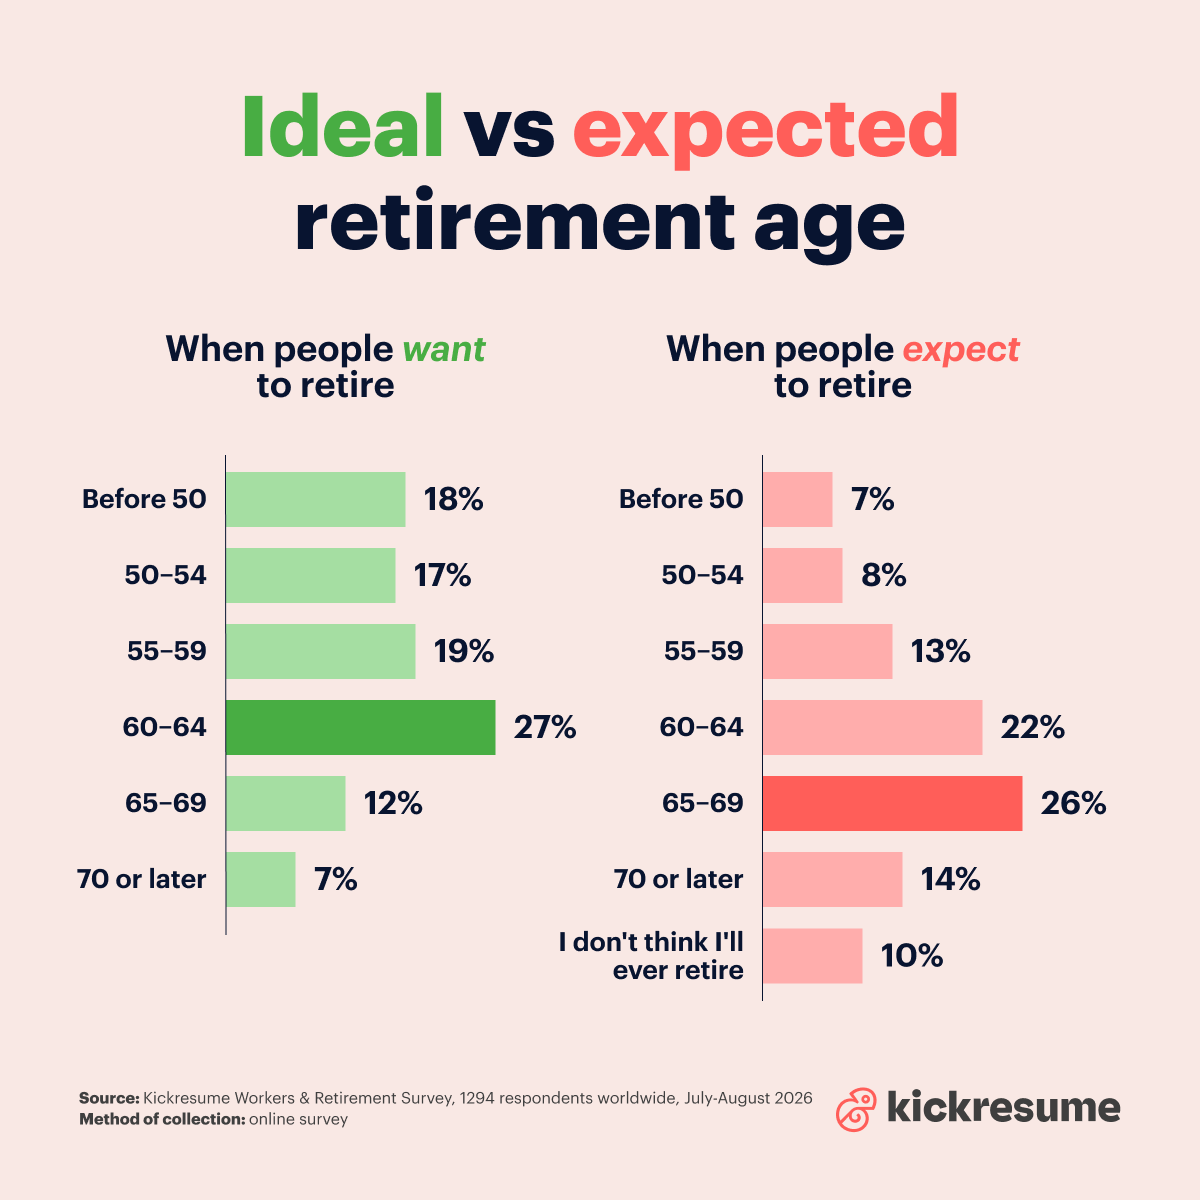
The two rankings tell different stories. 54% would like to retire before 60. Only 28% think they will. At the other end, 24% expect to work past 70 or never stop—against the 7% who'd choose that.
For 57%, those two things don’t match: they expect to retire later than they’d ideally like. Another 34% expect to retire around the age they want to, while just 9% think they’ll beat their own target.
The average ideal age is 58; the average expected age is 62—a personal shortfall of four years.
10% say they don’t think they’ll ever retire. That number climbs steadily with age: from 6% among 18–29-year-olds to 17% among those aged 62–80 (the group with the least time left to change course).
But there’s an even bigger gap by employment status: 18% of people who aren’t currently working expect never to retire, compared with just 7% of full-time employees.
Women want to leave earlier and expect to stay longer
The two answers pull in opposite directions for women. 57% of women want to retire before 60, against 52% of men. But only 25% expect to, against 29% of men.
Measure it person by person and the gap between hope and expectation is 5.6 years for women, 4.1 for men. The rest of the pattern runs the same way:
- Never expect to retire: women 14%, men 7%
- Expect to work past 70: women 29%, men 21%
Only 24% expect a state pension—60% are backing themselves
Knowing when people want to retire is only part of the picture. We asked where workers expect their retirement income to come from, and the ranking is a story in itself:
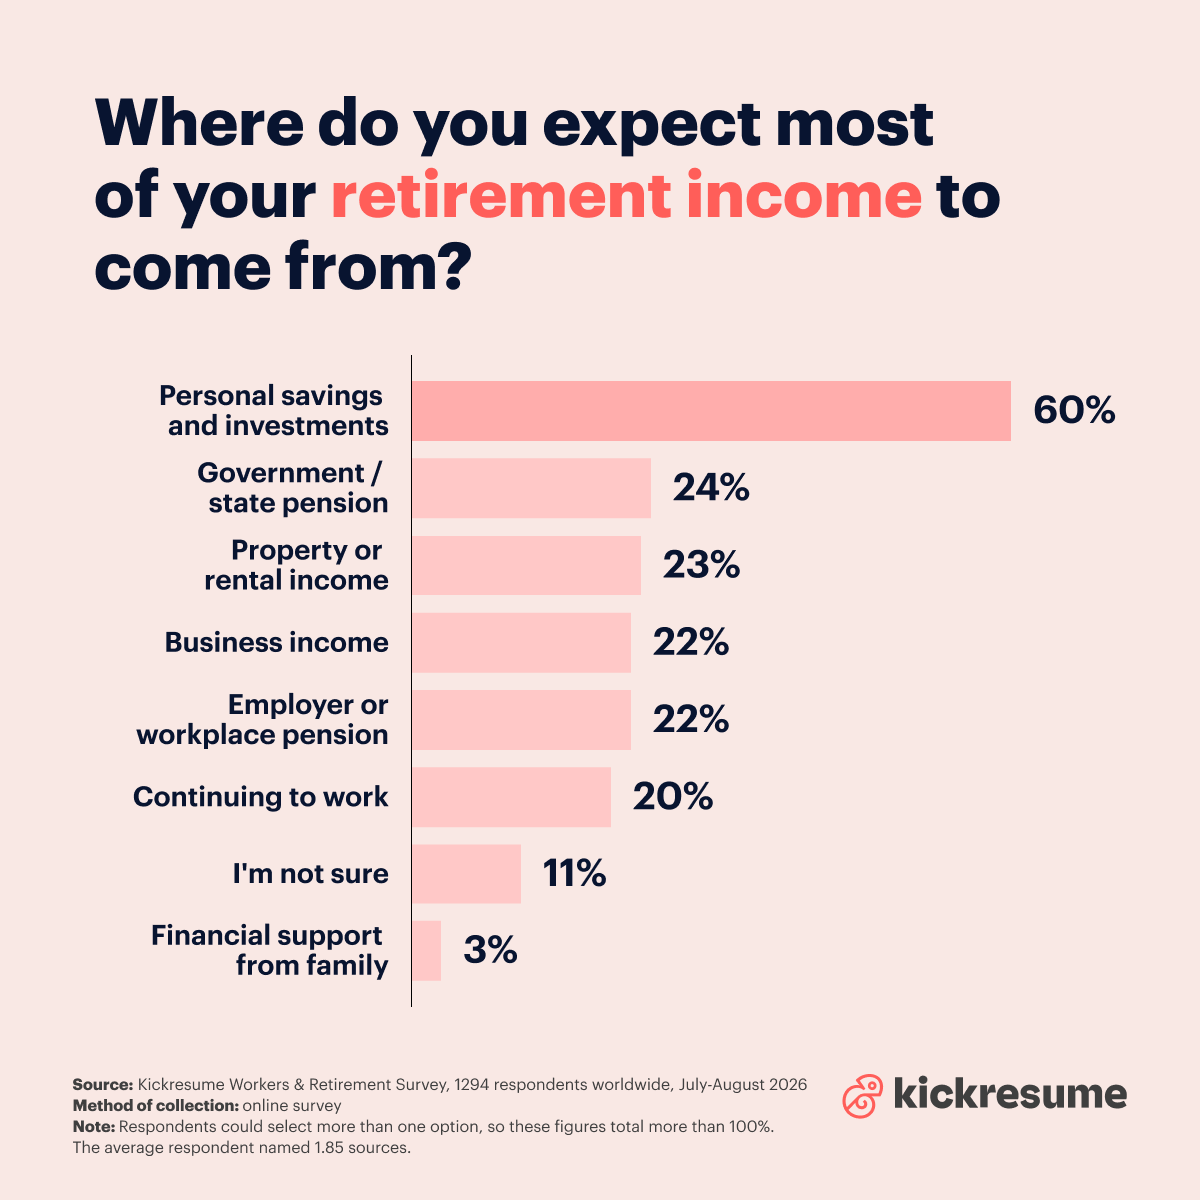
People are two and a half times more likely to name their own savings than the state pension. Property and business income each match employer pensions. And the options that depend on someone else—state pensions, workplace pensions, and family support—all sit in the bottom half.
Only 40% named a pension of any kind—state, workplace, or both. That leaves six in ten expecting no pension income at all.
Two other answers are worth reading closely. 20% named continuing to work—not as something they'd enjoy, but as income they're relying on. And 11% chose "I'm not sure." That means more than one in ten people can't name a single source of money for their retirement.
Europe still expects a state pension. Asia doesn't.
Where people live changes this answer more than anything else does, and it tracks how each system was built:
- Europe: 35% expect a state pension
- Latin America: 26%
- Africa: 22%
- North America: 22%
- Asia: 13%
Europeans are more than twice as likely as Asians to rely on a state pension. Latin America has the highest share planning to work for their income (28%), against just 8% in Africa.
67% think they've got it harder than their parents
For most people, the retirement their parents had feels increasingly out of reach. Two-thirds (67%) think they'll have a harder time retiring comfortably than their parents did, while just 12% think they'll have it easier.
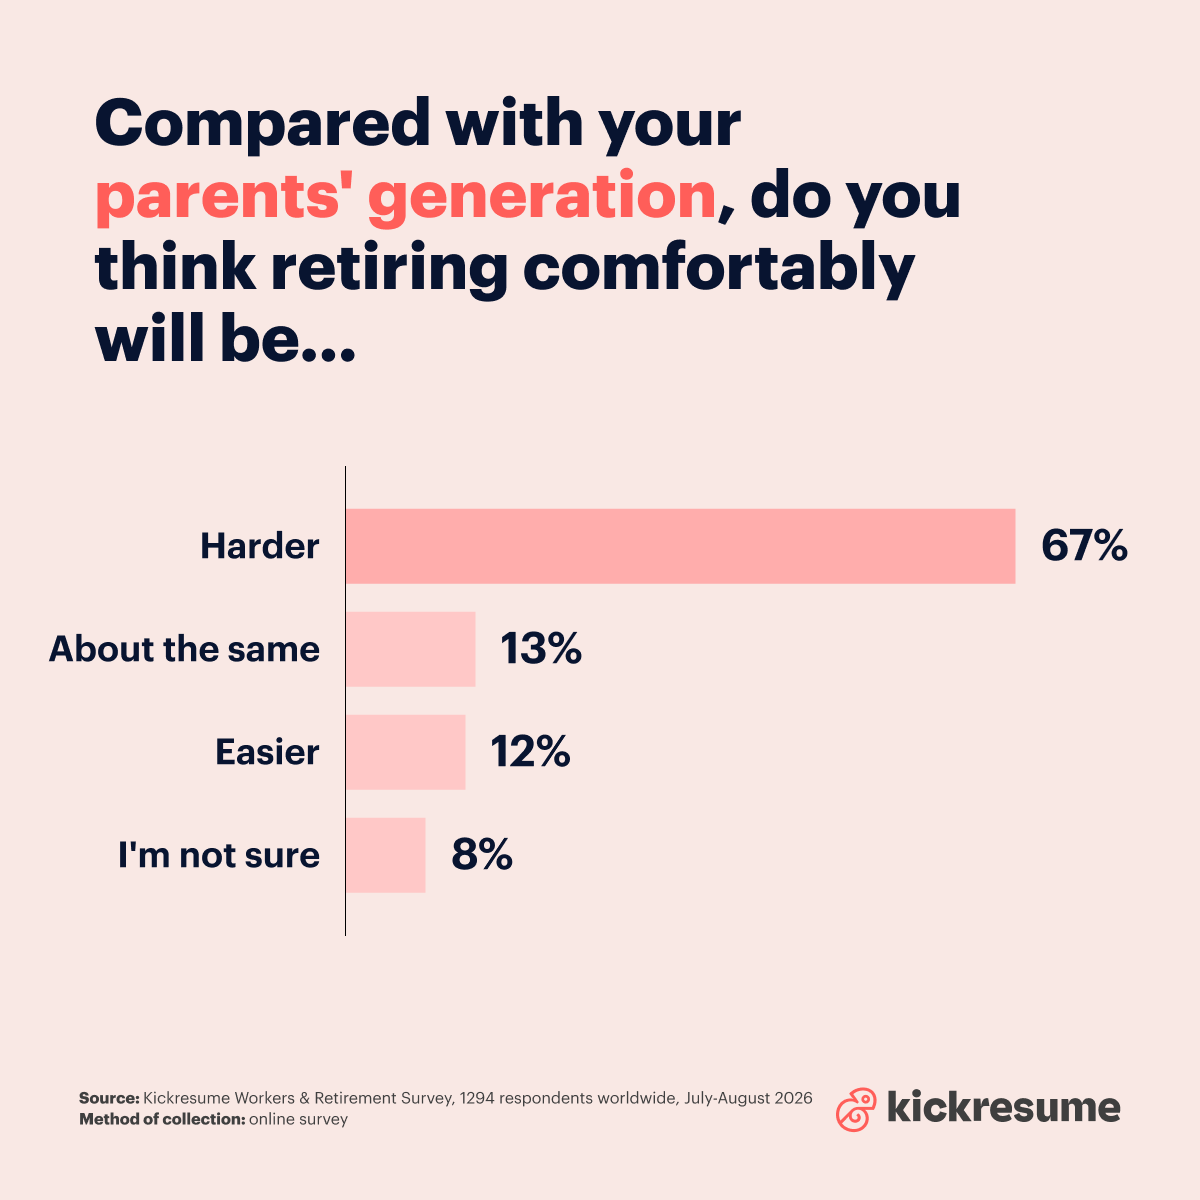
This isn't younger people projecting. It holds across every age group—61% of 18–29s, and 69% of both 30–45s and 46–61s. Even those closest to retirement are saying the same thing.
American respondents are the gloomiest in the survey
- USA: 79% say harder
- Europe: 71%
- Latin America: 62%
- Asia: 57%
- Africa: 47%
Nearly four in five Americans think they've got it harder than their parents did. Only 8% think it'll be easier—the lowest figure anywhere in the survey. In Africa, 28% think so.
Confidence is lowest among the people closest to retiring
We asked people how confident they are that they'll be able to retire comfortably, on a scale of 1 to 5. Here’s what we found:
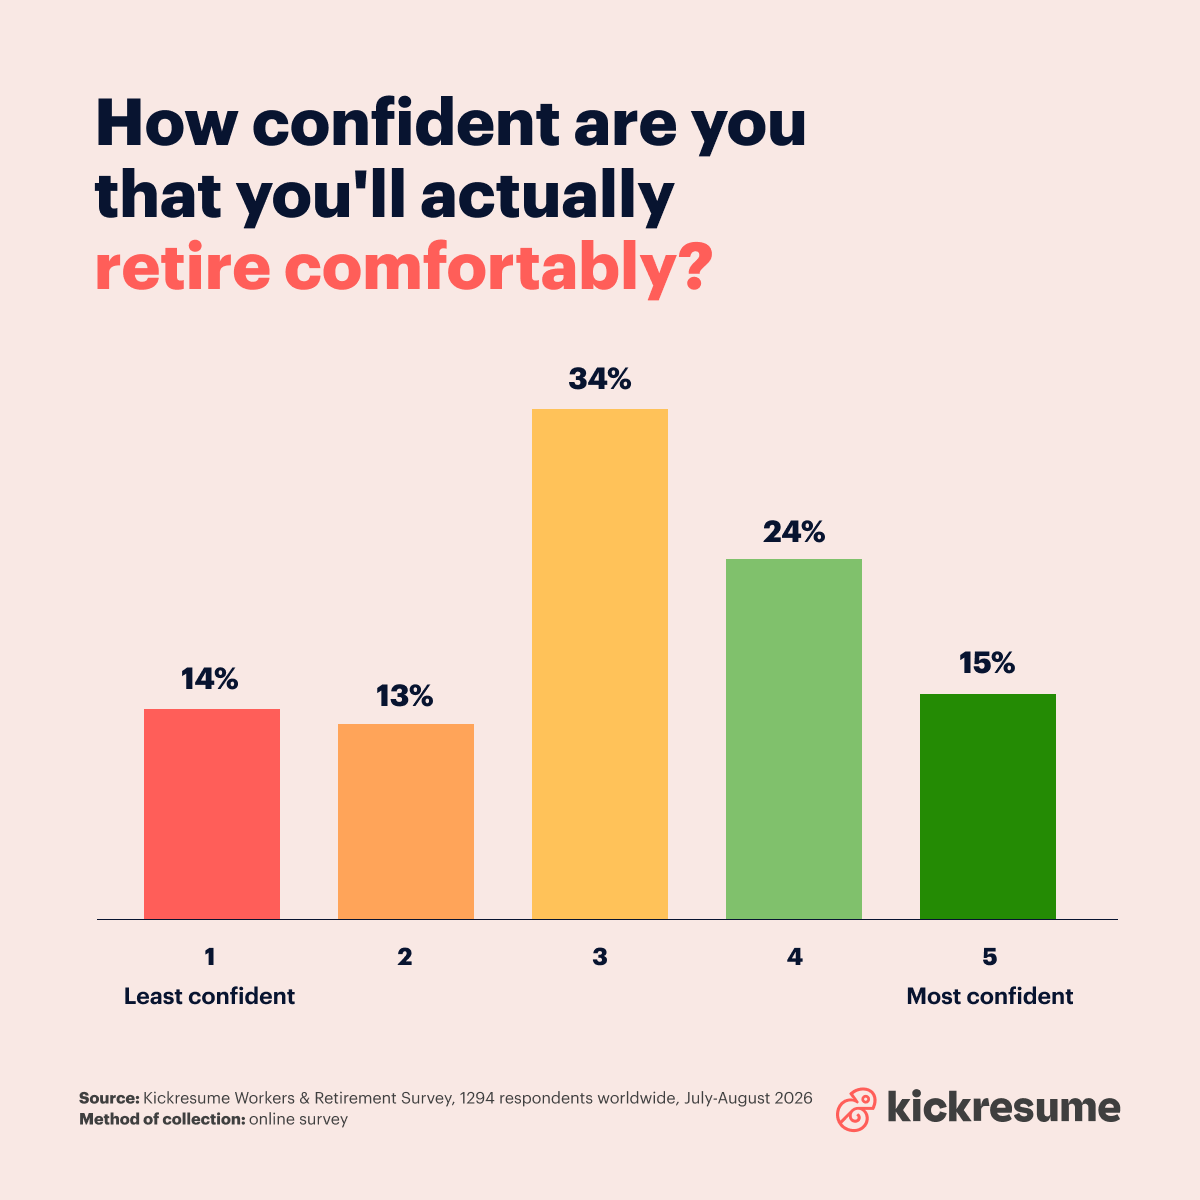
27% put themselves at the bottom of the scale, 39% at the top, and the biggest single group sits in the middle at 3—not confident, not panicking.
But the overall picture changes quite a bit by age. You might expect confidence to grow as retirement gets closer. Instead, it dips:
- 18–29: 23% low, 46% high
- 30–45: 26% low, 37% high
- 46–61: 30% low, 35% high
- 62–80: 30% low, 44% high
The 46–61s are the least confident group in the survey—gloomier than people thirty years further from retiring. That's the age when the sums stop being hypothetical. The working years left are easy to count, and so is what's been saved.
The US is the only place where doubt beats confidence
The US is the only place in the survey where more people put themselves at the bottom of the scale than the top. Everywhere else, confidence wins—in Asia, by more than three to one.
- Asia: 15% low, 52% high
- Africa: 18% low, 48% high
- Latin America: 28% low, 36% high
- Europe: 31% low, 33% high
- USA: 37% low, 33% high
The difference may partly come down to what people are comparing their situation with. If someone's parents had little retirement provision to begin with, their own situation can look like an improvement, even if the amounts involved are smaller.
In the US, the comparison may be different: many people are looking back at parents who were able to retire, often with a pension that is much less common today.
A third think they'd need over $5,000 a month
Americans doubt they'll get there. Everyone else mostly thinks they will. But get there to what, exactly? Nobody had named a figure yet, so we asked for one: the monthly income, in today's money, that people think they'd need to retire comfortably:
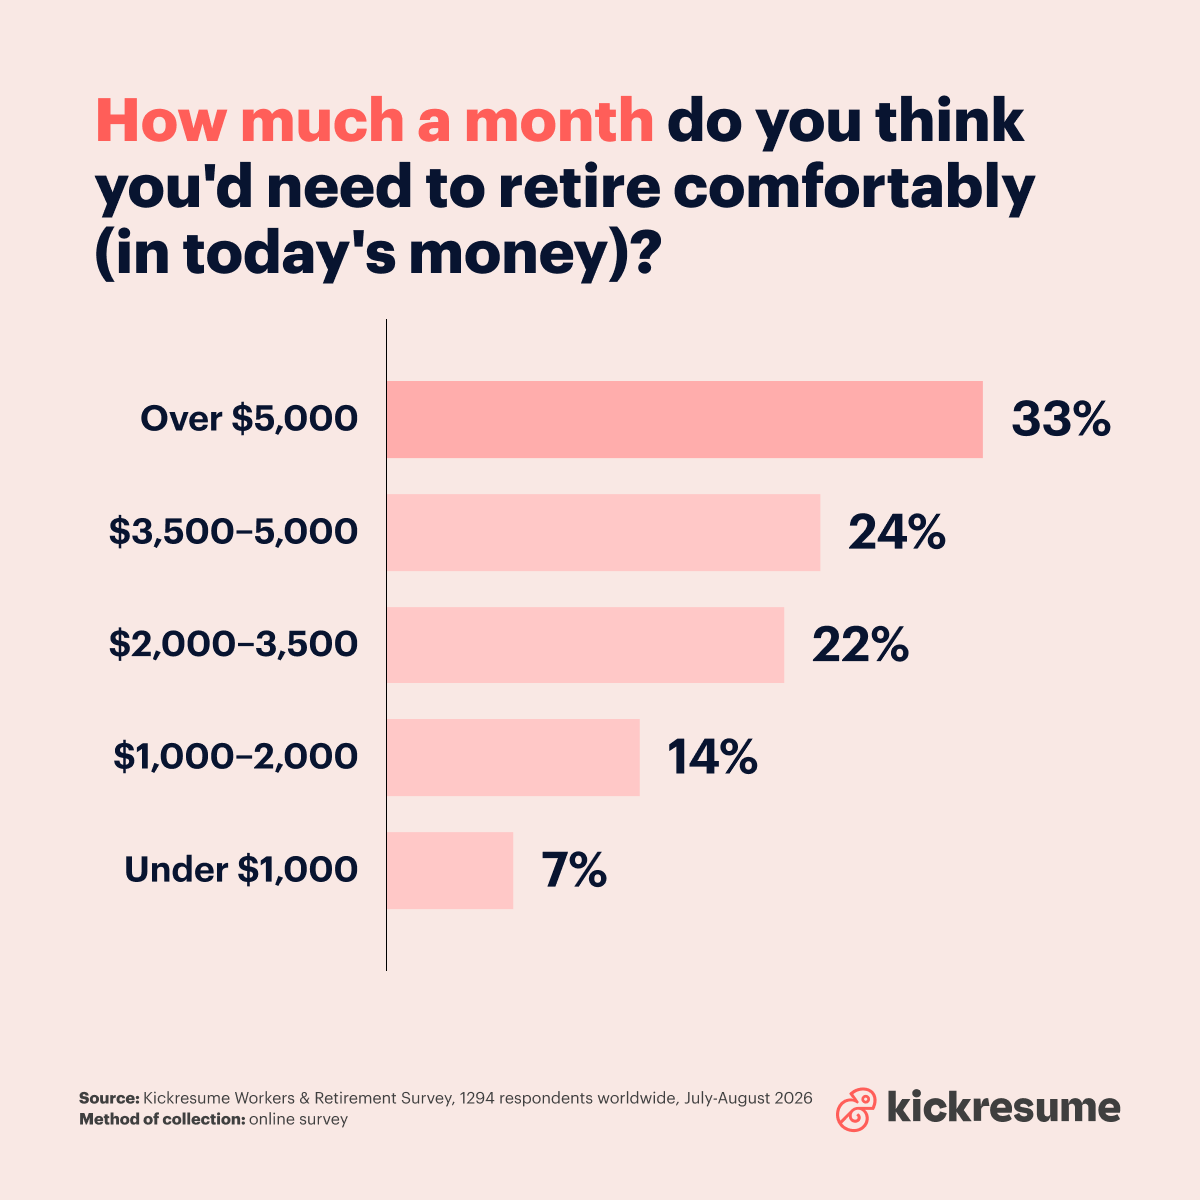
A third named a figure above $5,000 a month. That's above $60,000 a year, with no salary behind it, for however long retirement lasts.
The numbers are big. A common rule of thumb says you can withdraw about 4% of your retirement savings each year, meaning $60,000 a year would require around $1.5 million saved. Even $2,000–$3,500 a month would require roughly $600,000–$1 million. And 57% want at least $3,500 a month.
The number barely shifts by age or gender. It swings wildly by country.
- North America: 53% say over $5,000
- Africa: 35%
- Asia: 25%
- Latin America: 22%
- Europe: 19%
More than half of American respondents put the bar above $5,000 a month. Fewer than one in five Europeans do, and their most common answer was $2,000–3,500.
What's striking is how little else moves this figure. Men and women answer almost identically (32% and 34%), and so do the age groups—33% of under-30s name over $5,000, and 31% of 46–61s.
So this isn't really a question about life stage or gender. It's a question about what things cost where you live, and about who's expected to pay for healthcare once the salary stops.
13% aren't doing anything—and it shows in their confidence
People want a lot from retirement. Whether they're doing enough to get there is another question. So we asked what steps they're actually taking to prepare.
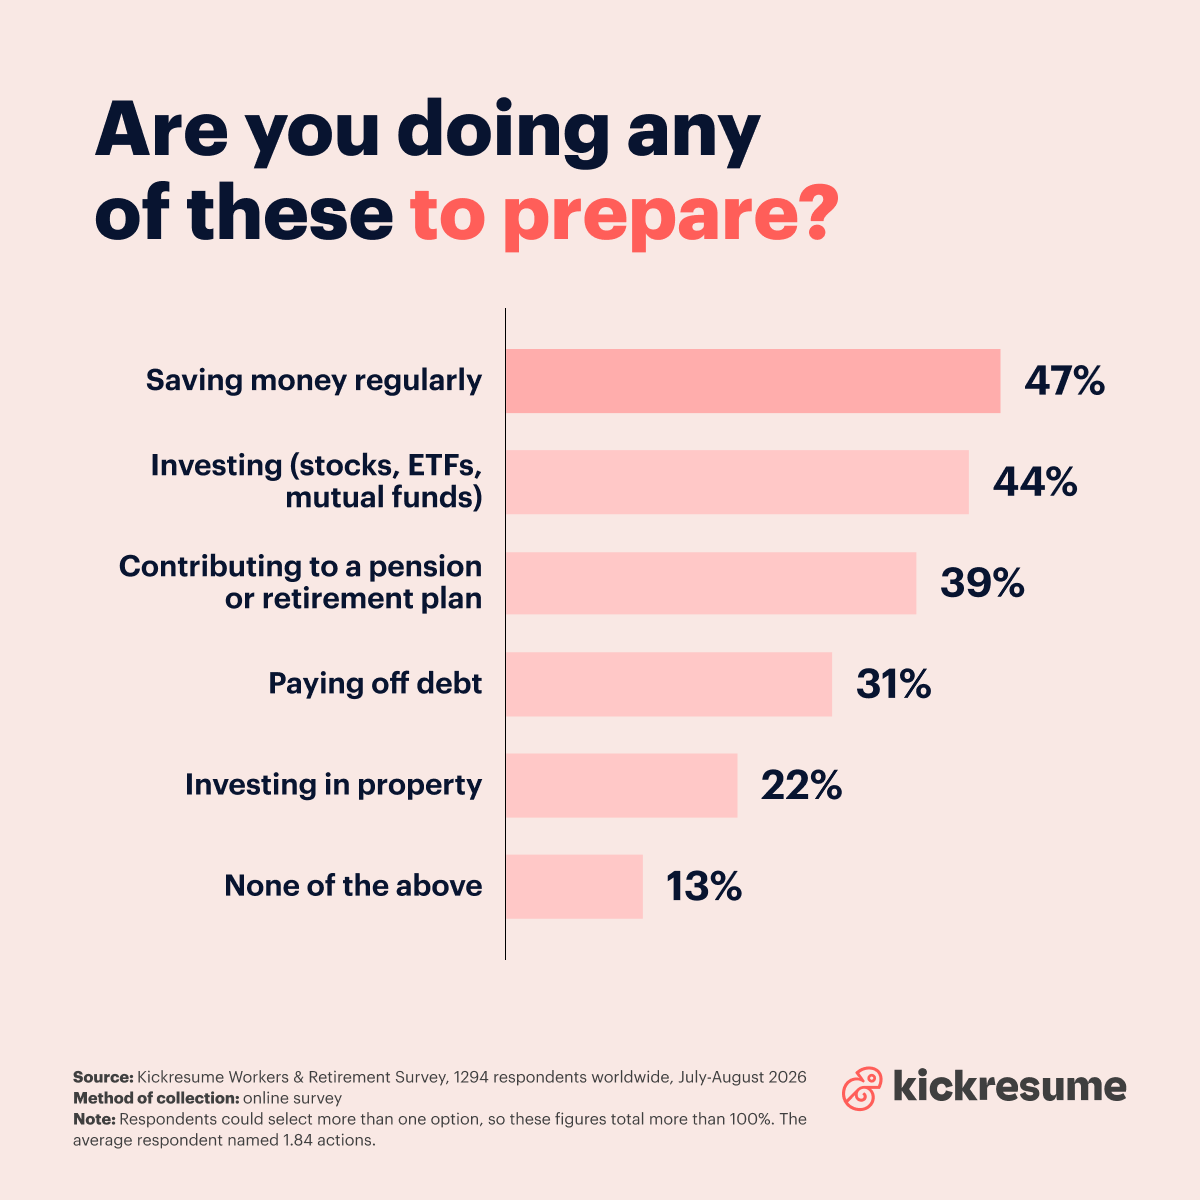
The first thing to notice is that no answer clears 50%. Saving money regularly tops the list, and fewer than half of people are doing it.
Investing sits almost level with it at 44%, which is unusual—normally saving runs well ahead of investing, and the fact that it barely does here says something about how many people have given up on the idea that a savings account alone will get them there.
13% selected none of them. Not saving, not investing, not paying into a pension, not paying down debt.
For women, the gap is in investing, not saving
The useful finding here is what doesn't differ:
- Saving money regularly: men 47%, women 48%
- Contributing to a pension: men 40%, women 39%
- Paying off debt: men 31%, women 33%
- Investing in stocks, ETFs or funds: men 47%, women 39%
- Investing in property: men 25%, women 17%
- None of the above: men 11%, women 17%
Almost identical when it comes to saving. Almost identical when it comes to pensions. The gap opens up in the two things that grow: women are 8 points less likely to invest in the market and 8 points less likely to buy property.
That changes how the confidence gap reads. It isn't that women are preparing less—the saving behaviour is nearly the same. It's that more of the money is sitting still, and sitting still is what makes the difference over thirty years.
Parents buy property. Non-parents keep the cash where they can reach it.
Gender isn't the only thing that changes how people save. Having children does it too.
Parents put money into property at 26%, against 18% of people without children. That gap holds in every age group, so it isn't simply that parents are older. People without children save regularly instead: 53% of them, against 41% of parents.
Both groups are preparing. They're just doing it in different forms. A house is money you can't easily get at, and for a lot of parents that's the appeal—it's somewhere the family lives now and something to pass on later. Money in a savings account can be moved next week, and if nobody else is depending on it, there's less reason to lock it away.
That said, slightly more people without children are doing nothing at all: 15%, against 10% of parents.
A quarter want a raise. Only 7% want a better pension system.
Only four in ten people feel confident they’ll be able to retire comfortably. And despite that uncertainty, most people aren’t taking enough action to improve their chances.
So what would actually make the biggest difference?
We asked people to name the one thing that would most improve their chances of a better retirement. Their answers point to a mix of personal finances and wider economic pressures:
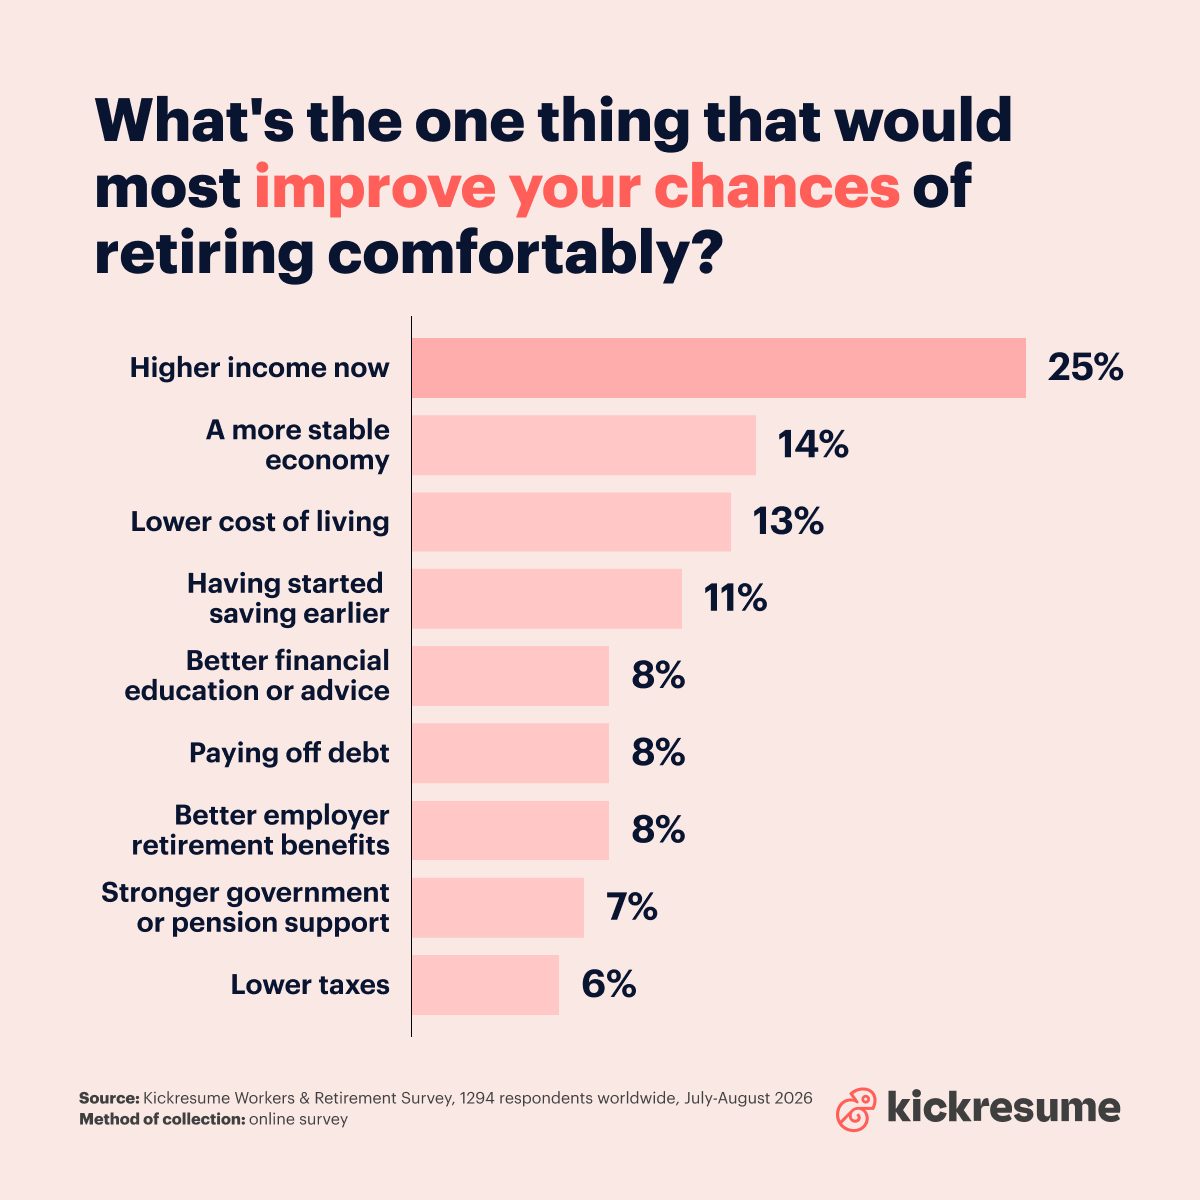
The biggest answer is simple: more money in the paycheck. One in four people say higher income would do more for their retirement than anything else. That beats a more stable economy (14%) and a lower cost of living (13%).
In other words, people aren’t primarily asking for a better pension. They want more room to save.
There’s another telling result: 11% say their chances would be better if they had started saving earlier. They can’t change that now, but it shows how many people feel they’ve already fallen behind.
And only 8% point to better financial advice or education. That suggests the problem may not be that people don’t know they should save for retirement. For many, the bigger problem is having enough money left over to actually do it.
A fifth are afraid of becoming a burden
Money is a big part of how people think about retirement. But it’s not their only worry. We asked workers what they’re most afraid of when they think about retirement—and their answers show just how wide-ranging those fears are.
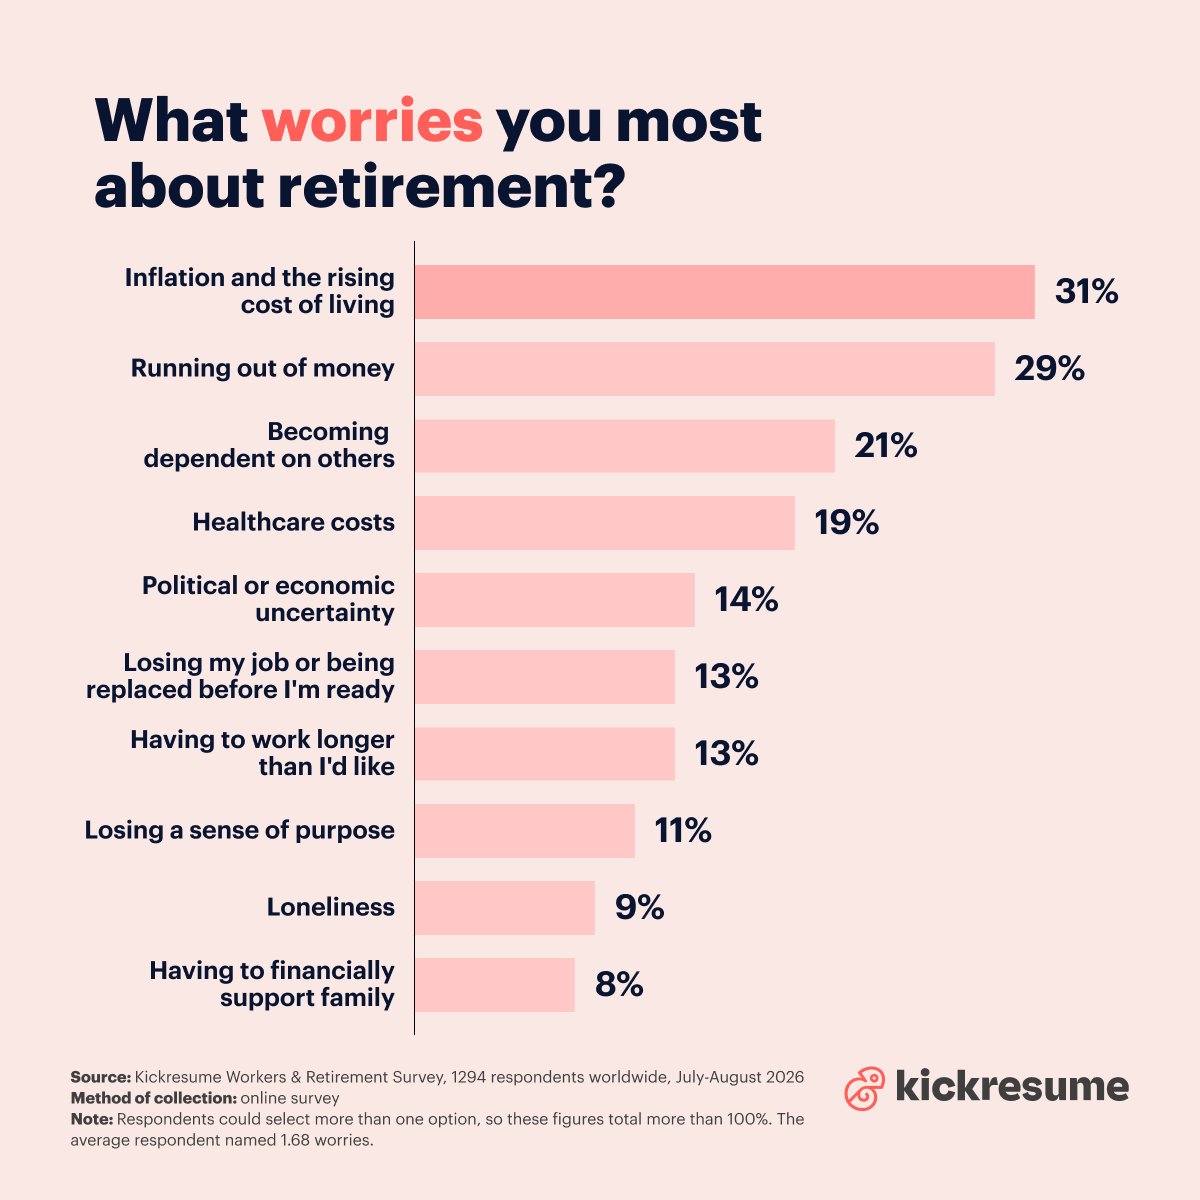
The two biggest worries are financial: 31% are worried about inflation, while 29% are worried about running out of money. But the third biggest concern is where the worries become more personal.
One in five people is afraid of becoming dependent on others—ahead of healthcare costs. Add the 11% who fear losing their sense of purpose and the 9% who fear loneliness, and about a third of the survey named something money can't fix.
Those aren’t abstract retirement risks. They’re everyday fears: having to rely on other people, losing the sense of purpose that work once provided, or becoming more isolated as your social circle shrinks.
Young people worry about the empty days. Older people worry about the bills.
The list changes noticeably with age.
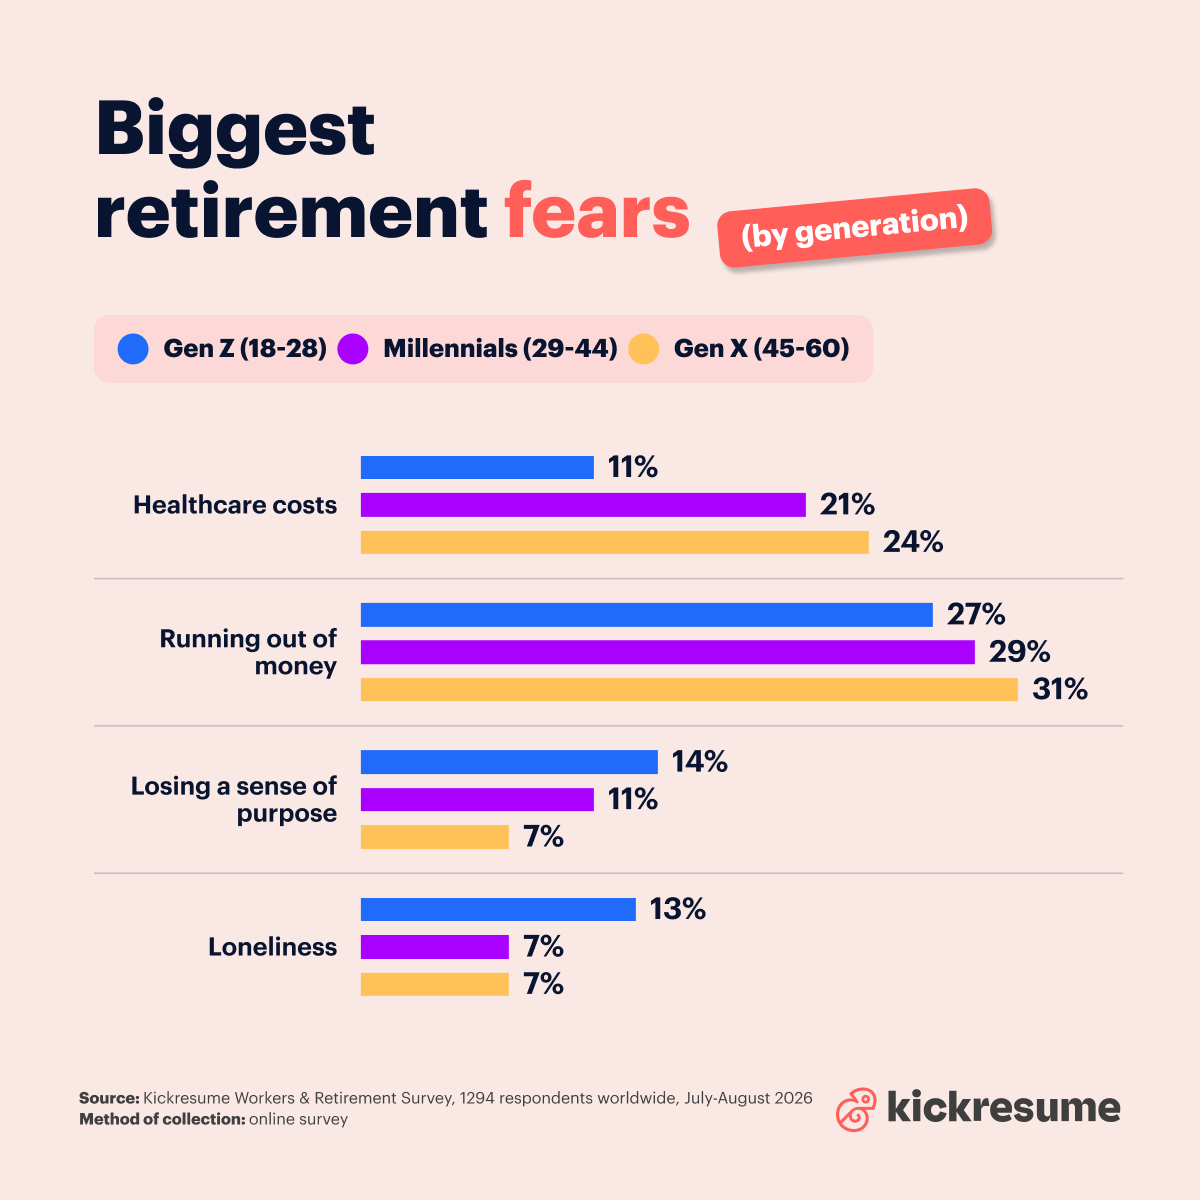
Healthcare worries double between Gen Z and Gen X. But purpose and loneliness move in the opposite direction: Gen Z is nearly twice as likely as Gen X to name either one.
It would be easy to dismiss that as young people simply not understanding the cost of getting older. But there’s probably something more basic going on: different worries feel real at different ages.
At 25, healthcare costs decades away can feel like someone else’s problem. By your fifties, retirement is no longer a distant idea—and neither are the costs that can come with ageing.
A quarter want to retire abroad—and cost of living isn't why
Money, timing, and worry all came out differently, depending on the country people live in. So another question was whether they plan to stay in it.
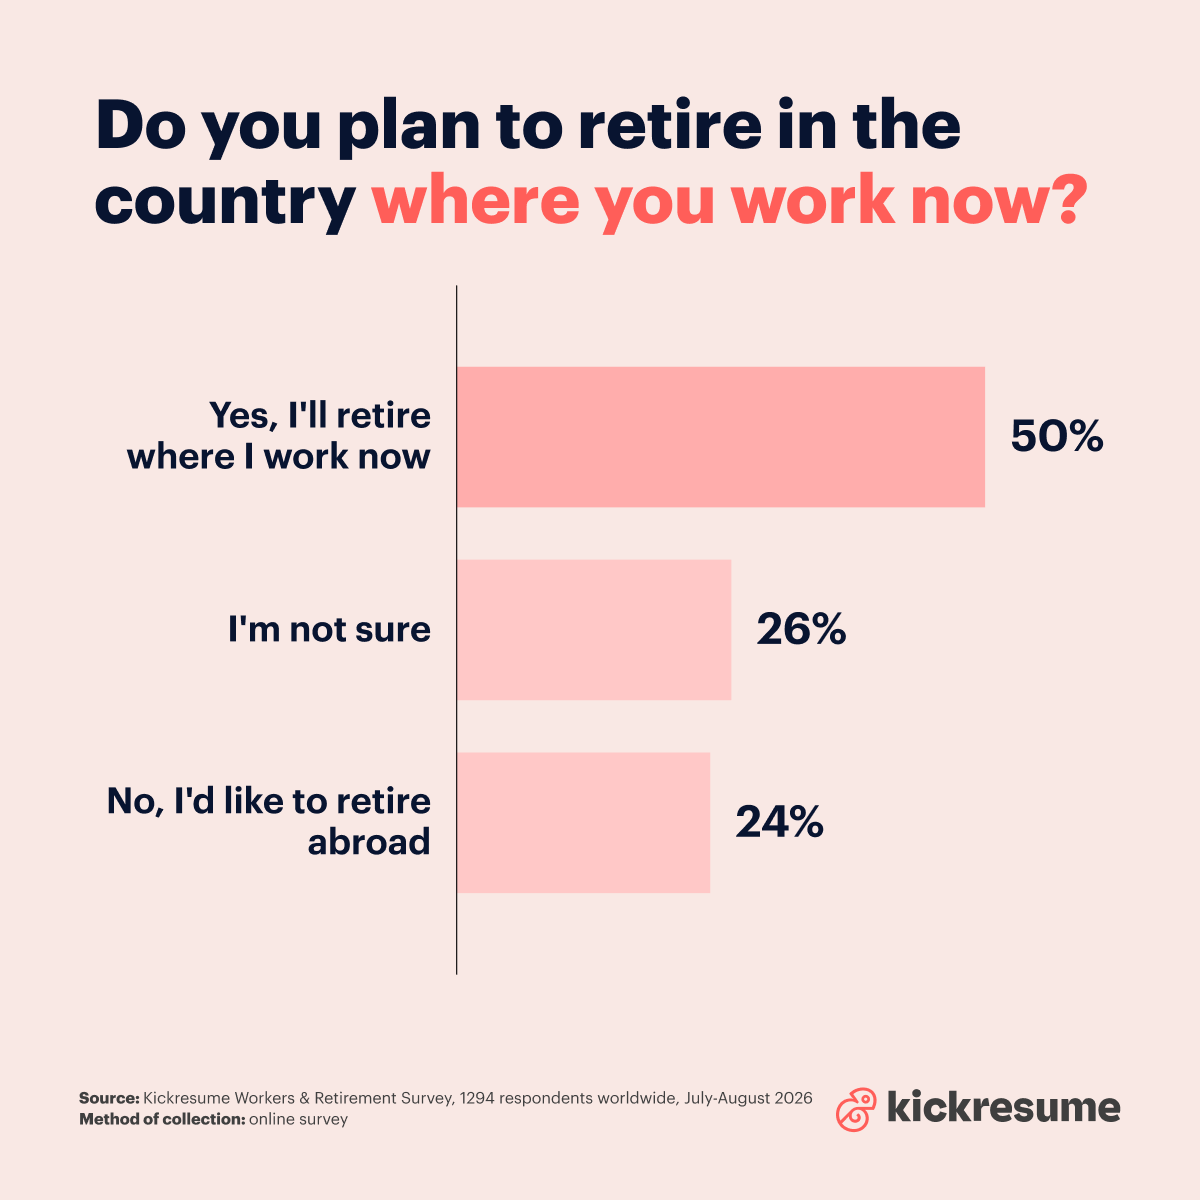
Only half plan to stay put. A quarter want to leave, and a quarter haven't decided.
Where people live changes this a lot:
- Africa: 34% want to retire abroad
- Asia: 30%
- Europe: 24%
- USA: 17%
- Latin America: 15%
These figures, however, don’t seem to track how people feel about retirement at all. Africa and Asia are the two regions most likely to want to leave—and also the two most confident about retiring comfortably.
The US is the gloomiest group in the survey by a distance, with 79% saying they’ve got it harder than their parents did, and Americans are also among the least likely to consider retiring abroad.
And so, for those who do want to retire abroad, we asked why. The answer is less about money than you might expect: 54% say they’re looking for a better quality of life, while 40% are drawn to a different lifestyle or culture.
Lower living costs were a factor for just 18%, and lower taxes for 6%. So for people who want to move abroad, this looks less like an escape from financial pressure and more like a choice about how they want to live.
Here’s the full breakdown:
- Better quality of life: 54%
- To enjoy a different lifestyle or culture: 40%
- Better healthcare: 19%
- Lower cost of living: 18%
- Better weather: 16%
- To be closer to family: 10%
- Lower taxes: 6%
A third of people just want to travel
Better quality of life and a different culture are the big draws for people considering retirement abroad. But where people want to live is only part of the picture. We asked everyone—not just the quarter who plan to leave—what they actually want their retirement to look like.
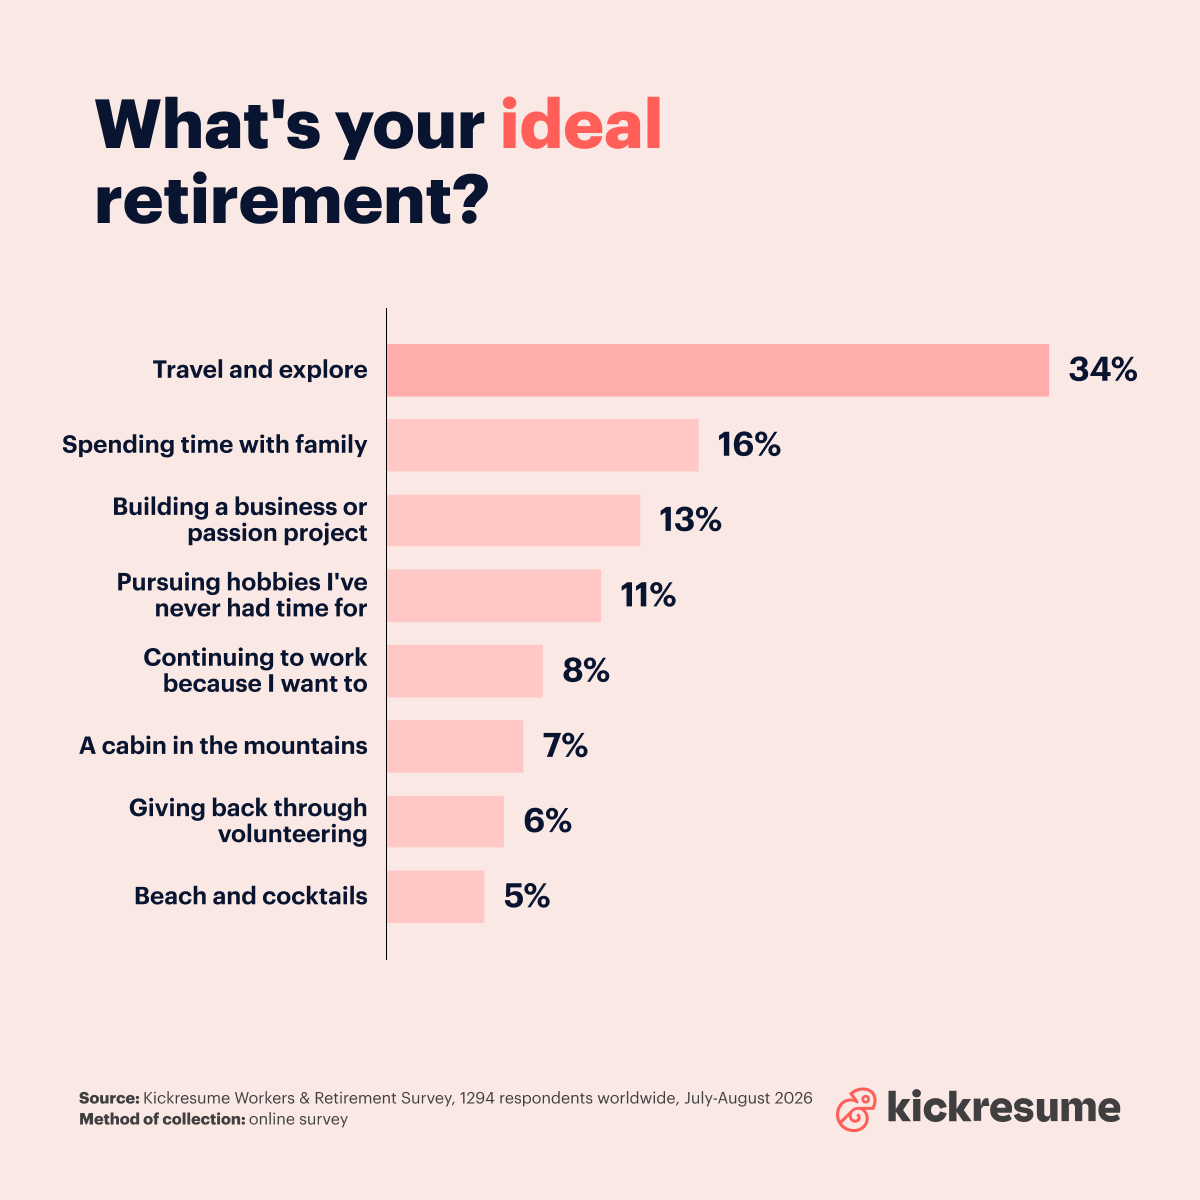
Travel wins at 34%, more than double anything else. The classic retirement postcard—beach and cocktails—comes last at 5%.
And 8% want to carry on working because they want to, rising to 25% among 62–80s. Set that against the 20% expecting to work because they'll need the money, and it's worth keeping the two apart. For some people work is the plan. For others it's the fallback.
Final thoughts
The same conclusion keeps coming back: people have decided retirement is a private problem.
Only 24% expect a state pension and only 40% expect any pension at all. Six in ten are building on their own savings, and one in five expects to keep working. Two-thirds think they've got it harder than their parents did. And when asked what would help most, just 7% asked for better government or pension support—the second-lowest answer on the list.
But deciding to fund it yourself and actually funding it are two different things. A third of people say they'd need more than $5,000 a month. Fewer than half are investing, and 13% aren't doing anything at all. That gap isn't spread evenly either: women save as much as men but invest less, and are twice as likely to think they'll never retire.
What people actually want isn't extravagant. A third of them just want to travel. Beach and cocktails came last. The most common answer to what would help was simply more money in the paycheck—and 11% said what would have helped is starting earlier, which is the one answer on the list that gets harder to act on the longer you leave it.
Demographics
Age
- 18–29 (Gen Z): 30%
- 30–45 (Millennials / Gen Y): 39%
- 46–61 (Gen X): 25%
- 62–80 (Baby Boomers): 6%
- 81+ (Silent Generation): under 1%
Gender
- Man: 67%
- Woman: 32%
- Non-binary or other: 1%
Location
- USA: 25%
- Europe: 25%
- Asia: 23%
- Latin America: 12%
- Africa: 8%
- Canada: 4%
- North America (country not specified): 2%
- Australia / Oceania: 1%
Work situation
- Full-time employee: 49%
- Not currently working: 16%
- Freelancer / self-employed: 14%
- Student: 8%
- Part-time employee: 7%
- Business owner with employees: 3%
- Informal or casual worker: 2%
- Unpaid family worker: 1%
Parents
- No: 54%
- Yes: 44%
- Prefer not to say: 2%
Note
This anonymous online survey by Kickresume gathered insights from 1,294 respondents from around the world. All participants were reached via Kickresume's internal database.
About Kickresume
Kickresume is an AI-based career tool that helps candidates source jobs and raise salary with powerful resume and cover letter tools, skills analytics, and automated job search assistance. It has already helped more than 8 million job seekers worldwide.